One-NDS Load

Overview
Comprehensive monitoring and analysis of One-NDS traffic
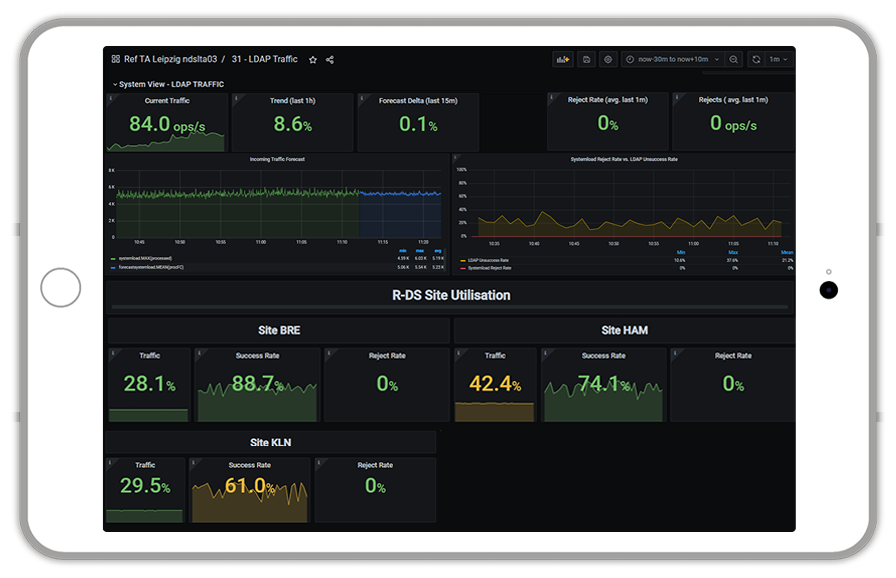
One-NDS Load and Traffic Analyzer (ndsLTA) enables detailed monitoring and analysis of One-NDS traffic. ndsLTA processes the statistical data provided daily by R-DS and BE-DS and prepares it for different graphical representations. In addition, the data is stored for a long period of time in order to enable retrospective analyzes or to determine and analyze changes in behavior based on historical data. This version supports pattern recognition for anomaly detection, detection of bottlenecks, short- and long-term forecasts.
Interactive web-based interface provides various dashboards with evaluations simply and intuitively. The interface offers several views so that all perspectives and use cases are covered as far as possible. In addition, the ndsLTA is designed so that further dashboards / views are possible without additional effort (e.g. by configuring and setting up additional dashboards).
![]()
Your Benefits
ndsLTA automates and optimizes operational monitoring of the One-NDS with the following advantages:
Autonomous monitoring and evaluation of One-NDS traffic
Notification and automatic reporting
Short reaction times
Dashboards for targeted analysis in the event of an incident
Capacity Planning support and initiating preventive measures
Dashboards
The following dashboards are predefined within the software:
System Performance 24h-Overview
Overview about system utilization over the last 24 hours (suitable for daily reports)
Realtime System Performance
Real-time view of ongoing One-NDS utilization including short-term traffic forecast
System Overview
R-DSA and BE-DSA System Overview
BE-DSA Statistics
Detailed statistics for BE-DSA‘s
BE-DSA Short-term forecast
Real-time view of ongoing BE-DSA’s utilization including short-term traffic forecast
BE-DS Server Statistics
Detailed BE-DS server statistics suitable for troubleshooting
R-DS Server Statistics
Detailed R-DS server statistics suitable for troubleshooting
OP5 BE-DSA
Display of TOP5 utilized BE-DSA’s
Provisioning Overview
Monitoring of provisioning request success rate and dedicated errors
Long Term Forecast
Prediction of capacity needs based on historical data
Monitoring
ndsLTA self-monitoring
handcrafted by vividblack